-
ICAP PROJECT
- Overview
- Background
- Objectives
- Data Feature
-
Methodology
- Overview
- TFP Estimates
- Level Comparison
- Measure
-
Data Source
- Australia
- Canada
- United States
- EU Countries
- Download Manual
OVERVIEW
-
BACKGROUND
Improving agricultural productivity continues to be the most efficient way to maintain agricultural output growth, and thus it helps with achieving the United Nation Sustainable Development Goal by 2030 (Ziberman, 2020; van der Brouer, 2020; FAO 2021). Sustainable productivity growth also improves the resilience of agricultural production to external shocks, including resource degradation, climate change and the zoonotic/disease pandemic etc.
Agricultural Total Factor Productivity (TFP) is a widely applied measure of agricultural productivity levels and growth, gauging efficiency and efficacy of production units in farm sectors using multilateral inputs for gross outputs from an economic perspective. It also provides the best currently available means of assessing progress in sustainable agricultural intensification at the national or regional level, if properly adjusted to account for non-market inputs and outputs.
In the literature, there are two broad quality tiers of currently available metrics of agricultural TFP – the first tier meets high international standards for economic productivity accounting like those recommended by the OECD or developed through the KLEMS model (used for developing internationally comparable measures); the second tier provides less refined TFP indexes due to incomplete agricultural statistics (OECD 2021, insights). The first tier is only separately available for a few countries, including the United States, Canada and Australia, while the second tier is dominating in most other countries but distorting the public opinion of agricultural growth and cross-country disparity in reality due to its systematic measurement errors.
While important, a cross-country consistent agricultural TFP measure is not available, because few efforts has been made to construct the consistent agricultural production account across countries. Hence, it is essential for the academic and the government agencies to develop a standard approach and data compilation to construct up-to-date, accurate and internationally comparable TFP indexes for agriculture.
-
OBJECTIVES
We aim at providing a state-of-art method that could be used for measuring relative levels of agricultural inputs, outputs and TFP, as well as their rates of growth, for the OECD countries (as a start) and then to facilitate cross-country comparisons of agricultural productivity. The method is applied to construct cross-country consistent production accounts relative levels of agricultural TFP as well as its growth rates for agriculture for 18 out of 26 OECD countries for the period of 1973-2018, and for China for the period of 1978-2018. The dataset will be continuously updated, and extended to cover more developed and developing countries, such as Brazil, Russia, India, Agentina and so on.
The database has allowed the dissemination of high-quality statistics on relative levels and growth of agricultural productivity using the methodologies of national accounts and input-output analysis. The database and the underlying production account will support empirical and theoretical research in the area of agricultural production and rural development, such as study of the relationship between capital deepening, technological progress and innovation in agriculture on the one hand, and agricultural productivity growth and its cross-country difference, on the other.
-
Data Feature
We adopt the index number approach and base it on the growth accounting framework (Jorgenson, 1986). The approach is developed based on a strand of literature including but not restrict to Ball (1997), Ball et al. (2001, 2010), Sheng et al. (2015), Ball et al. (2008, 2018, 2020) and among others. We then apply the approach to construct the production account for agriculture consistently across 18 out of 26 OECD countries, including 15 EU countries (Austria, Belgium, Denmark, Finland, France, Germany, Greece, Ireland, Italy, Luxembourg, the Netherlands, Portugal, Spain, Sweden and the United Kingdom) and the United States, Canada and Australia and measure and compare the relative levels of agricultural TFP for those countries for the period of 1973-2018.
The database provide the measures of purchasing power parities (PPP) for agricultural inputs and outputs, and thus allow comparison of relative levels of agricultural input, output and TFP across countries.
Depending on the request, we also provide the data on detailed agricultural outputs and inputs, which include
1) Price and quantity indexes for commodity-level agricultural output: cereals, oil crops, cotton, sugar, other cash crops, vegetable and melons, fruits and nuts, animal meat, animal products;
2) Capital stock and capital service flows: building and structures, transportation vehicle and other machinery, biology capital and/or inventory;
3) Land stock and land service flows (quality adjusted): Marginal contribution of 23 land attributes to land prices;
4) Price and quantity of labor input: hired workers, self-employed (non-paid labor);
5) Price and quantity of major intermediate inputs: electricity, fuel and lubricant, pesticides, fertilizers
6) Other purchased inputs: feed and seed..
METHODOLOGY
-
OVERVIEW
We construct the production accounts for agriculture (or farm sectors) of each country. Data are collected and compiled based on a gross output model. Specifically, agricultural output is defined as gross production leaving the farm, as opposed to real value added, while agricultural inputs are not limited to labor and capital but include intermediate inputs as well.
read more
-
TFP ESTIMATES
Agricultural total factor productivity (TFP), at the industry level, is defined as the ratio of a gross output index to a total input index. Under strict neoclassical assumptions of Hicks-neutrality of production technology, perfect competition and constant returns to scale, growth of the TFP index measures the rate of technological progress (Balk, 2008; OECD, 2001).
read more
-
LEVEL COMPARISON
We construct the purchasing power parity (PPP) to implement the level comparison of agricultural outputs and inputs. The relative price indexes for agricultural output and input at the based year were constructed using the purchasing power parity (PPP) for each currency. The Törnqvist index was used to chain-link the cross-country comparable prices (or PPP) to construct a time series of relative price indexes in each country. Agricultural output and input quantities are derived as the norminal value dividing by the relative price index
read more
-
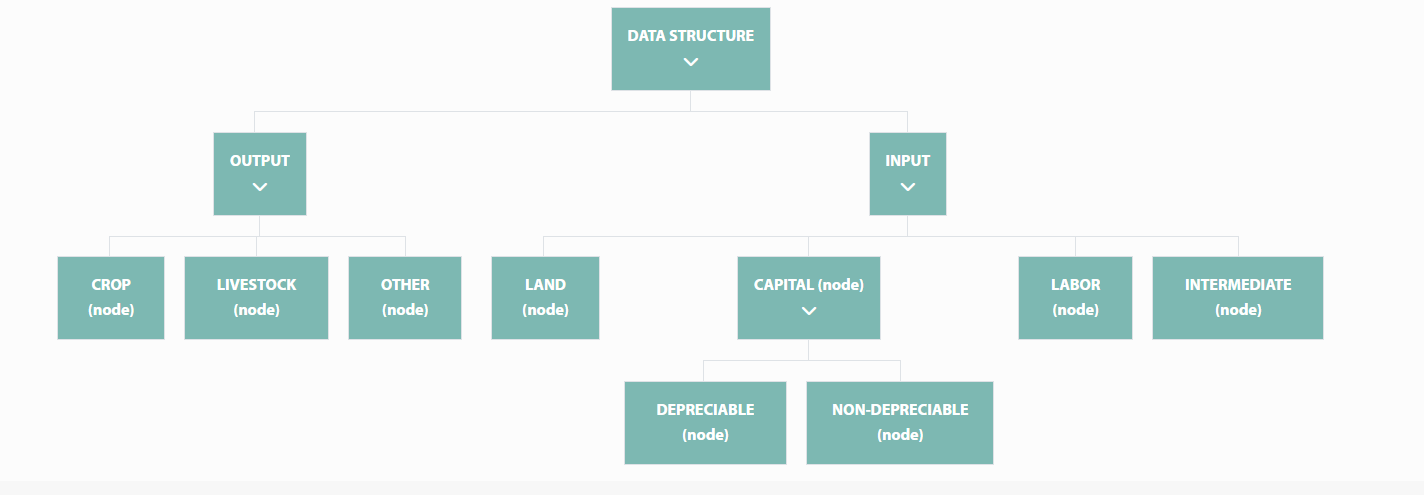
DATA STRUCTURE
DATA SOURCE
We have constructed agricultural production accounts for 18 OECD countries over the period 1973-2018. These countries include 14 EU countries (Austria, Belgium, Denmark, Finland, France, Germany, Greece, Ireland, Italy, Luxembourg, Netherlands, Portugal, Spain, Sweden) and the United Kingdom, the United States, Canada and Australia. Agricultural production accounts for more other countries, including China, India, Brazil and other Latin American countries are now under construction.
-
Australia
Australian Bureau of Statistics (ABS)
Australian Bureau of Agricultural and Resource Economics and Sciences (ABARES)
-
Canada
Canadian Statistics
Agri-Food and Agriculture, Canada
-
United States
The US Department of Agriculture – Economic Research Service (USDA-ERS)
-
EU countries
Eurostat
Bureau of Statistics of Individual EU countries